MRR
The MRR (Monthly Recurring Revenue) report provides a detailed view of your subscription revenue over time. It is a central tool in GrowPanel for tracking growth, understanding revenue trends, and identifying customer behavior patterns.
Overview

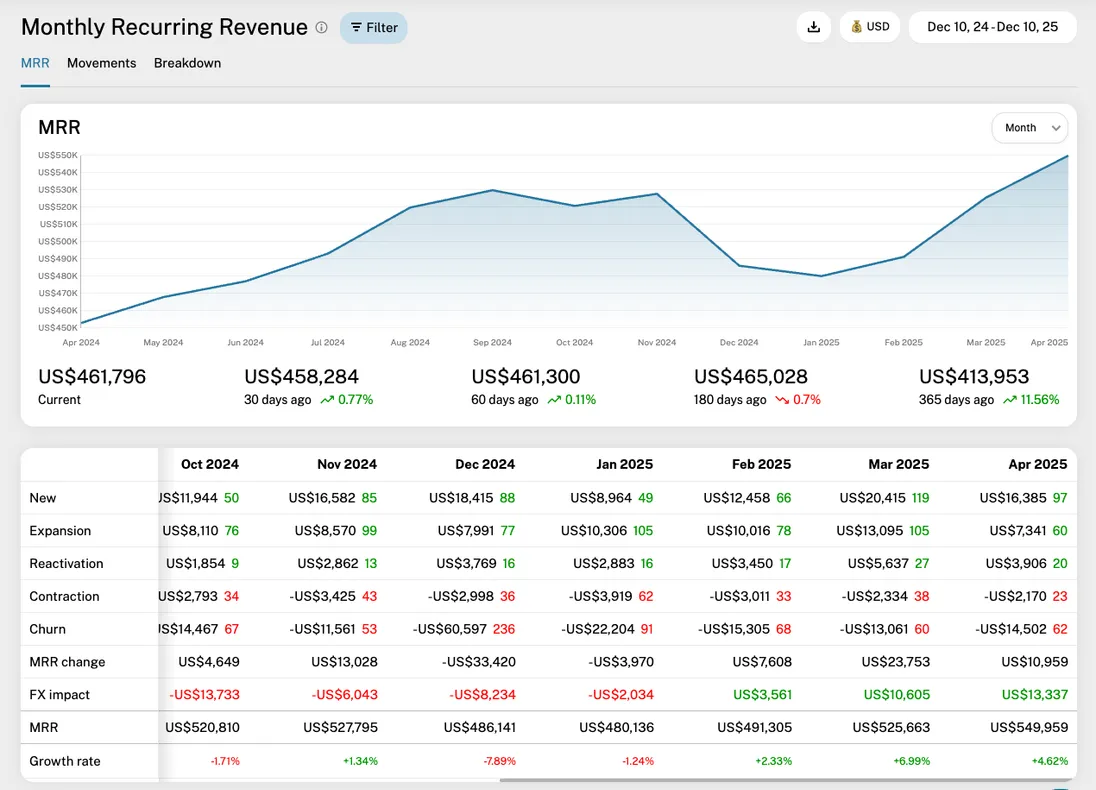
The MRR report includes a chart, a breakdown table, and optionally a detail table. Each is described here:
Timeline chart
The timeline chart shows your MRR over the selected period. If you hover the chart, you'll see a tooltip with the MRR movements broken down in types (explained under the Breakdown table), and you'll see the corresponding period marked in the table underneath. The currenly ongoing period is marked as a dashed line. You can adjust the chart data using the date picker, currency picker, interval selector and a wealth of filters, explained in the Filters section underneath.
Note that the numbers for a given period shows how those numbers looked at the end of the period.
Breakdown table
The table underneath the chart shows the MRR, broken down into MRR movement types: New, expansion, reactivation, contraction, churn. It also shows Net MRR movements and currency fluctuations (FX impact). The table scrolls horizontally and if you hover the columns, you'll see a line in the chart showing the corresponding period. Each type is explained here:
New
Recurring revenue from newly acquired customers.
Expansion
Recurring revenue growth from existing customers due to upgrades, discount changes or billing frequency updates. A change from yearly to monthly payment can also contribute to expansion if the monthly plan has higher MRR.
Reactivation
Recurring revenue recovered from returning customers that previously churned.
Contractions
Reductions in recurring revenue from downgrades, discount changes, prices changes or billing frequency changes. A change from monthly to yearly payment can also contribute to contraction if the annual plan is cheaper on a monthly basis.
Churn
Recurring revenue lost from cancellations. A cancellation is classified as a churn when the customer does not have any other active subscriptions, and the MRR is zero.
MRR change
Net MRR change from real MRR movements (doesn't include currency fluctuations).
FX impact
Changes due to currency exchange rate fluctuations. This line is only shown if customers pay in a currency that's different that the reporting currency.
MRR
The MRR at the end of the period, including both MRR movements and FX impact.
Each cell of the table shows two numbers - an amount and a number. The amount shows the sum of the MRR movement type in the given period. Negative amounts are typically marked with a minus in front, depending on your locale. The number next to the amount shows the number of unique customers that contributed to this number. If a customer has multiple movements during the period, it's still only counted as one unique customer. Red numbers mean that the customers contributed with negative MRR, and green numbers mean positive MRR movements.
If you click a cell, a detail table under the breakdown table is revealed, showing all MRR movements in the selected period and type.
Detail table

This table is shown when you click a cell in the breakdown table. The table shows each MRR movement in the selected period and type. You see the date, customer name/email, the description of the MRR movement, the type (New/Expansion/Reactivation/Contraction/Churn) and the MRR change. If the MRR change is in a different currency than the reporting currency, you see the converted amount as well as the original amount in parantheses.
Clicking the customer sends you to that customer's detail page.
Filters
The report supports a wide range of filters to help you focus on specific segments of your business. These include:
Date range
Select a custom range or preset periods (last 30 days, last quarter, etc.)
Interval
Choose how MRR is aggregated: daily, weekly, monthly, quarterly, or yearly
Currency
Select your reporting currency. When switching reporting currency, the reports are calculated on the fly using daily historical exchange rates. If you want to fix/freeze FX rates in your reports, you can tick a checkbox, and all FX rates are fixed at the start date of the report. Example: if you see "Year to date", all FX rates will be fixed at the 1st of january.
Additional filters – plan, region/country, billing frequency, payment method, customer age, etc. (see all filters)
Filters are applied to both the chart and the table simultaneously.
Exporting the data
You can export the table as a CSV file for offline analysis or reporting by clicking the "Export" icon next to the date picker.
Practical tips
- Use the interval selector to understand trends at different granularities. Weekly intervals are useful for spotting short-term fluctuations, while monthly or quarterly intervals give a longer-term view.
- Use "All time" in the date picker to show you the numbers from when your first customer signed up.
- Fixing the currency is recommended when analyzing historical performance across multiple currencies, as it removes FX volatility from the analysis.
- Combine multiple filters to isolate specific customer segments or product lines, enabling precise revenue insights.